 Statomotive
SINCE 2022, AFTER INFLATION
+70%
We read 15,000 sales. After inflation, only 12 of the 41 cars with enough sales to measure are worth more than in 2022. Cars that cost over $150k are up 10%, the $40-80k band is down 18%, the manual premium hit 42%, and three in four quick flips lost money. Where the money went, what a spec is worth, how the winners buy and sell, and what comes next.
Monterey just set a record, and Hagerty's August market report has the average car sold there up 31% on the year and the median car up 5%, before inflation. Our own record agrees across every car we cover: 2026 so far against the same months of 2025, after 3% inflation, the average sale is up 23% and the median 9%, and sales over $150,000 went from 9% of the market to 15%.
A market where the average runs away from the middle is a market sorting itself. This report follows that sorting through six questions, using every sale in our record since 2019.
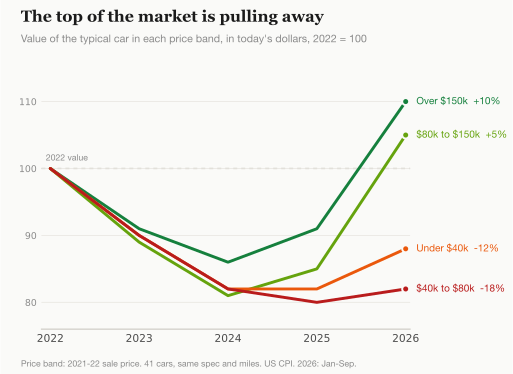
Every line starts at its 2022 value in today's dollars. The two top bands have climbed back above it after inflation; the two lower bands have not, though both turned up this year. Whether that lasts is the last section of this report.
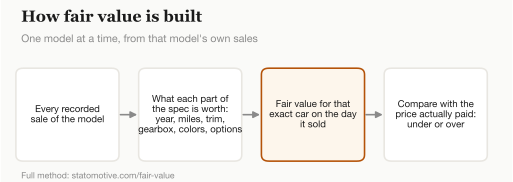
A word on fair value, since everything here leans on it. For every car we cover we start with every recorded sale: price, date, mileage and the full build sheet, from year and trim to gearbox, colors and options. Then we work out what each of those things is worth, one model at a time, so an E46 is only ever compared with other E46s. Fair value is what that exact car, with its miles and spec, should have sold for on the day it sold. Here is the full method.
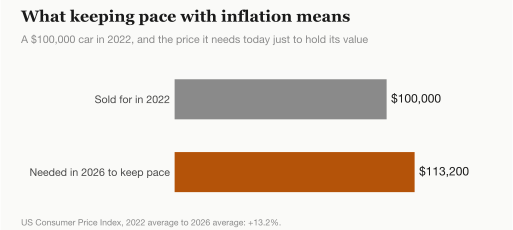
And a word on inflation. Prices rose 13% across the economy between 2022 and 2026, so a car that held its dollar price actually lost ground. Every price change over time in this report is adjusted for that: each sale is restated in today's dollars using the US Consumer Price Index before we compare. And we compare like with like: the same model, model year, spec and mileage sold at different times, so the change is the market moving, not cars getting older or adding miles. Where the money went is measured against 2022, the peak; the spec comparisons in section 2 use 2019-22 against 2023-26 so each side has enough sales; and section 6 looks at the months of this year. A zero means a car kept pace with inflation. Premiums between cars sold at the same time, such as what a manual brings over an automatic, need no adjustment and are shown as measured.
What a car cost in 2021 and 2022, and how old it is, explain 61% of how every car we cover has moved since. Every band fell into 2024. Since then, after inflation, cars that sold for over $150,000 in 2021-22 have climbed to 10% above their 2022 value and the $80,000 to $150,000 band to 5% above. The $40,000 to $80,000 band is still 18% below, and cars under $40,000 12% below. Across all 41 cars, 12 are worth more than in 2022 and the typical one is worth 10% less. Whether a model is mostly sold as a manual, or is naturally aspirated or turbocharged, does not predict which models rose once price is known. Inside each model the gearbox matters a great deal, as section 2 shows.
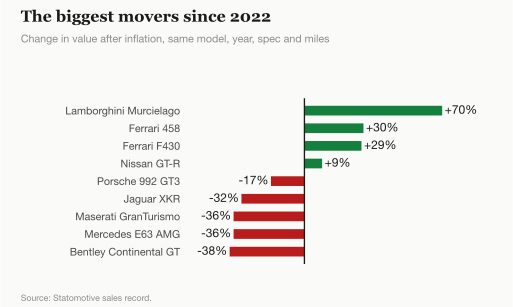
The top of the list since 2022, after inflation: Murcielago +70%, 458 +30%, F430 +29%. The bottom: Continental GT -38%, E63 -36%, GranTurismo -36%, XKR -32%. Price band is not destiny, though. The 992 GT3 is down 17% from the top band, and the GT-R is up 9% from a cheaper one. The 996 Turbo is up 23% after inflation this year alone, with the median sale going from $60,000 to $81,500.
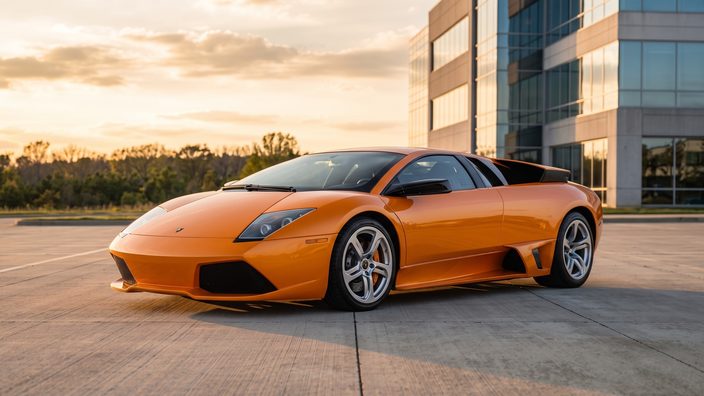
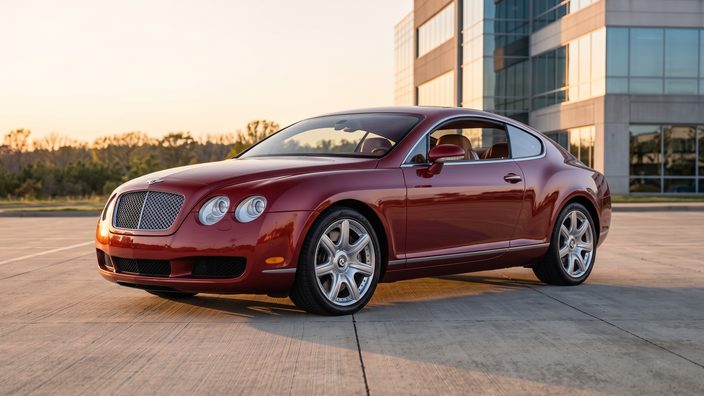
The modern McLarens are going the other way. With year, miles and trim held constant, the 570S has lost 26% since 2022 after inflation and the 720S 28%; the samples are thin, 37 and 46 sales, but the direction is consistent. Road and Track reports McLaren is offering 0% financing on a new Artura, which will not help.
Classic Driver asked last week whether prices for the last manual sports cars are about to peak. The sales record says the opposite. Across the 17 cars we cover where both gearboxes sell, the median manual premium was 21% in 2021 and 2022, 29% in 2025, and 42% so far this year. Hagerty puts the manual E60 M5's premium at about 50%; we measure 68% on 306 sales.
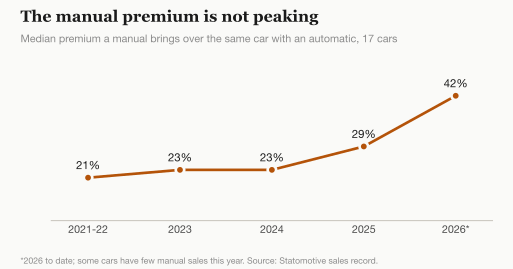
Look closely and the premium is widening because automatics are sinking faster. After inflation, across 18 cars the automatics lost a median 15% from 2019-22 to 2023-26 while the manuals lost 9%. Neither beat inflation; the manual just lost less. Mileage works the same way. On the ten models with enough sales at both ends, cars sold with under 30,000 miles lost a median 2% after inflation, close to holding their value, while cars with over 100,000 miles lost 12%. The gap between them widened on all ten; the typical low-mile car now brings more than twice what a high-mile one does. Across all 34 cars we can measure, the premium for a 10,000-mile car over a 40,000-mile one steepened on 29.
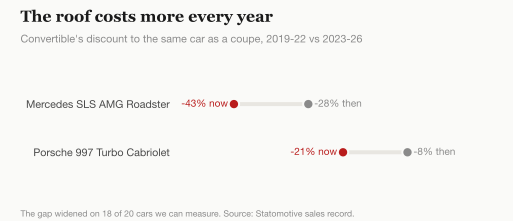
The roof is going the other way. The convertible's discount to the coupe widened on 18 of 20 cars. An SLS Roadster used to trade 28% under the coupe; now it is 43%. A 997 Turbo Cabriolet went from 8% under to 21%.
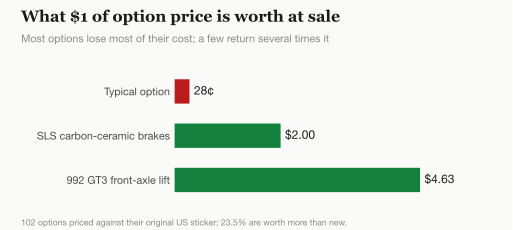
Options are mostly a bad investment, with a few exceptions. Of 102 options we can price against their original US sticker, 23.5% are worth more today than they cost new, and the median returns 28 cents on the dollar. The 992 GT3's front-axle lift cost $3,670 and is worth about $17,000 at sale today. The SLS's carbon-ceramic brakes cost $12,500 and are worth about $25,000. Both travel with well-specified cars, so read them as what cars with them sell for.
Paperwork pays more the older the car gets. An original window sticker adds 2.8% on average, rising with age: about 1% on cars 12 years old or newer, 4.5% on cars 19 years or older. A clean history report adds 3.6%. A car listed in kilometers loses 10.3%.
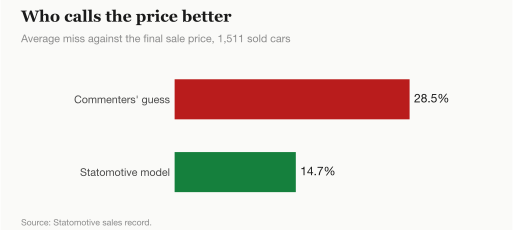
Commenters are loud and usually wrong on price. On 1,511 sold cars where commenters guessed a number, the guess missed by 28.5% on average. Our model, predicting blind, misses by 14.7%. A 2013 Ferrari 458 Spider in Blu Scozia drew five guesses with a median of $275,000; it sold for $350,000, and our model was within 3.2%.
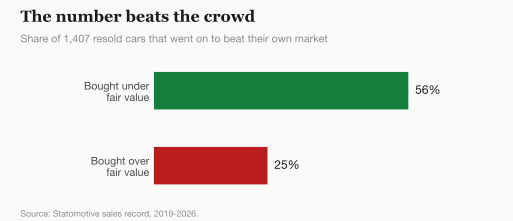
The better test is what happens after the sale. We followed 1,407 cars that sold and then sold again. When our model said the first buyer paid under fair value, the car went on to beat its own market 56% of the time. When the buyer overpaid, 25%. Once fair value is known, whether the comments called it a steal adds nothing.
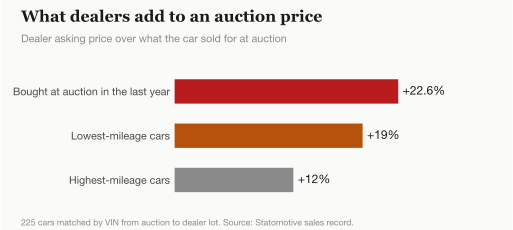
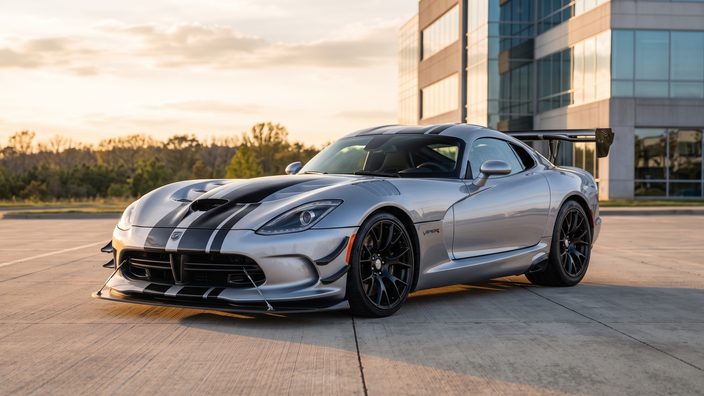
If you buy from a dealer instead, know what they paid. We matched 225 cars bought at auction to their listings on dealer lots today. The 100 bought within the last year are asking a median 22.6% more, $15,312, after 119 days and 117 added miles. A 2017 Viper ACR with 109 miles sold for $575,757 at auction on July 30 and was on a lot twelve days later at $699,980. Dealers mark the lowest-mileage cars up hardest: 19% over auction value, against 12% for the highest-mileage quarter.
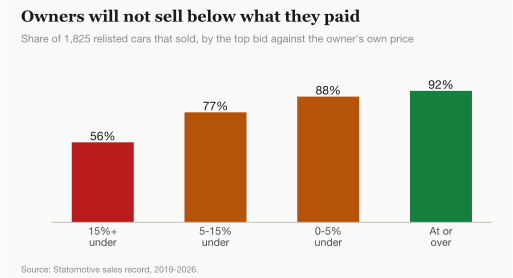
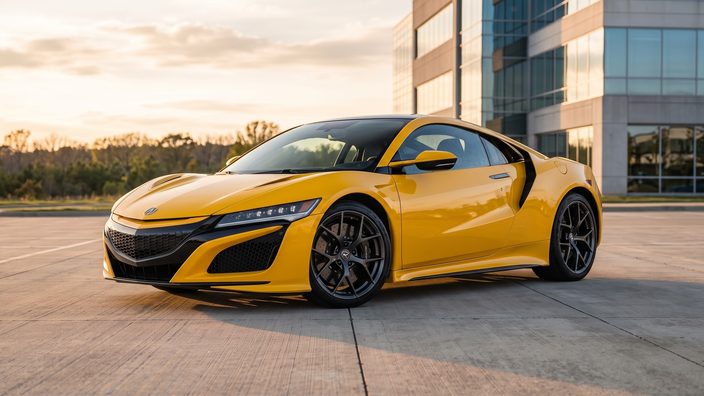
Most owners will not sell below what they paid, even when they should. On 1,825 relisted cars, 92% sold when the top bid met the owner's own purchase price. Once it fell 15% below, only 56% sold. A 2019 NSX in Valencia Red bought for $145,000 in 2023 was relisted in August 2025, drew $122,888, and did not sell.
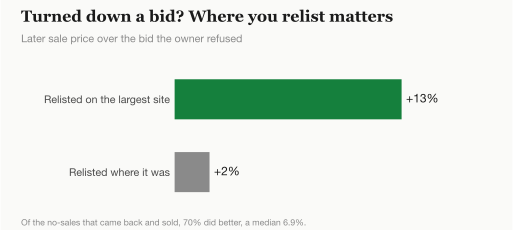
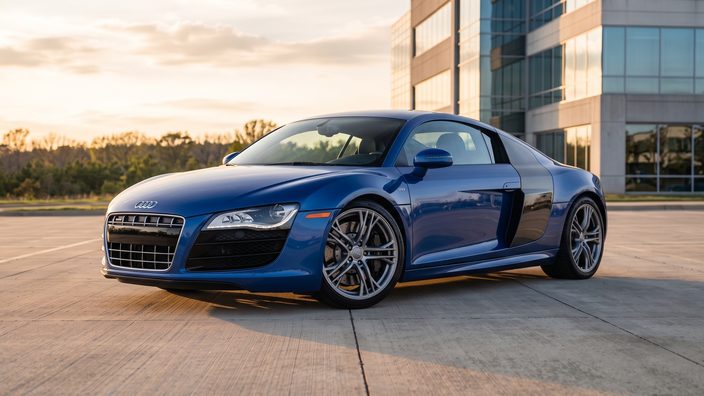
Turning down a bid is not always a mistake. Of the no-sales that came back to auction and sold, 70% did better, a median 6.9% over the bid they refused. Where you relist matters most: cars that moved to the largest auction site after a no-sale sold 13% over the refused bid, against 2% for cars that stayed where they were. A 2012 R8 V10 Spyder with a manual refused $142,000 in April and sold for $160,000 a month later on the other site.
Dealer sellers now make up 49% of sellers on the largest site, up from 26% in 2021, and there they get 2.3% more for the same car. On dealer lots, 82% of listings get cut at least once, and a car listed 30% or more over its value is almost twice as likely to still be sitting after six months.
One thing any seller can do: thank people. Sellers whose replies are consistently gracious get 4.7% more for the same car than sellers who never are.
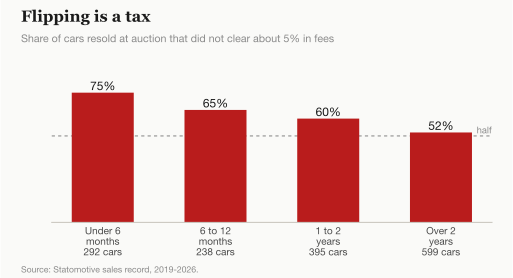
We found 1,524 cars that sold at auction twice. Resold inside six months, 75% did not clear a round trip of about 5% in fees. Every holding period we measured, from six months to over two years, trailed its own car's market by 2 to 5%. What separated the winners was the first price: after inflation, cars bought 10% or more under fair value came back a median 4% richer, and cars bought 10% or more over it came back 12% poorer. A 2011 R8 V10 manual that sold for $177,000 in 2021, 30% over fair value, resold for $138,596 two years later, a 28% loss in today's dollars.
This month's headlines are full of flips that worked: new LC 500s resold over sticker, a 30-mile GNX that changed hands twice in nine days. Those are the survivors.
Two more things to watch while you hold. Crossing 10,000 miles costs 4.7% at sale, measured against the car's own mileage curve; 30,000 costs 3.3%, and there is no cliff at 100,000. And prices are getting harder to read: the share of sales landing 20% or more away from fair value fell to 11.7% in 2023 and is back to 20.1% this year, noisier on 32 of 35 cars.
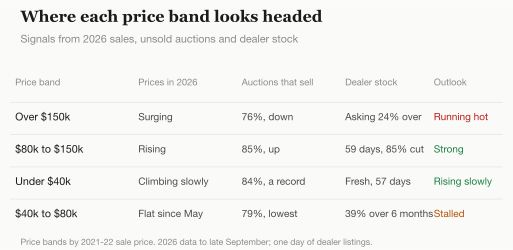
The bottom two bands turned up in 2026 too, so the question is whether that lasts. We looked at three things for each band: how prices moved month by month this year, how many auctions actually sold, and what the dealer stock looks like today.
Cars that cost under $40,000 are likely to keep rising, slowly. For the same car, spec and miles, their price in today's dollars climbed 14% between January and September, and 10 of the 12 models are up on the same months last year. 84% of their auctions now sell, the highest share we have recorded, and dealer stock is the freshest of any band: listed a median 57 days, and cut the least. Two things argue for patience rather than a boom. Half the models carry the gain, and the bids on cars that fail to sell now fall 17% short of fair value, against 13% a year ago. Sellers' reserves are starting to run ahead of the bidders.
The $40,000 to $80,000 band has stalled. Prices have moved sideways since May, and only 79% of its auctions sell, the lowest of the four bands. It also has the stalest dealer stock: 2,301 cars listed, 39% of them for more than six months, and 82% already cut. Sales are up 32% on last year at flat prices, which looks like dealers clearing inventory, not buyers bidding up. If the 996 Turbo, which carries much of the band's gain, cools, this band could slip back.
At the top, the $80,000 to $150,000 band passes every test: more cars selling, and the bids on unsold cars closing in on fair value. Over $150,000, prices are surging, but fewer auctions are selling than a year ago and dealers are asking 24% over fair value. That can mean a market running hot. We will know more by the end of the year; this quarter's data runs to late September, and we have one day of dealer listings so far.
Once inflation is counted, most of this market is worth less than in 2022: 29 of 41 cars are still below. The ones that recovered were expensive to begin with, and the buyers who came out ahead bought under what their car was worth. The right spec and the right example lost less than the rest. And the market charges for impatience: quick flips, overpriced asks and a refusal to sell below cost. Looking ahead, the cheapest cars are climbing slowly, the middle has stalled, and the very top may be running hot. The comment section is not the guide. The number is.